Reports
General
With nuevoMailer you have automatic tracking of clicked links & opens (views) for your html newsletters.
Every hyperlink in the newsletter as well as mailto: links are automatically converted to traceable links.
You can also have link tracking for your text newsletters (with pre-defined links).
Every hyperlink in the newsletter as well as mailto: links are automatically converted to traceable links.
You can also have link tracking for your text newsletters (with pre-defined links).
A few facts about your reports
- They are real-time reports.
- Click and mouse over all icons that you see. There are many goodies behind.
- Almost all reports are sortable. Click on the column headers.
- Charts can be saved as image (.png). Click this icon
- The charts are very interactive. Click on the legends, mouse over, change time frames, use your mouse wheel to zoom etc
- Who clicked/opened what and when.
- Detailed click & views per subscriber, campaign, newsletter.
- Latest, recent clicks & views.
- Clicks & views evolution over time, for all or a specific campaign. Timeline reports.
- What was the best performing link in one or more campaigns.
- Which were your top performing campaigns. Comparison reports.
- Average performance of selected campaigns combined. Aggregate reports.
- And much more.
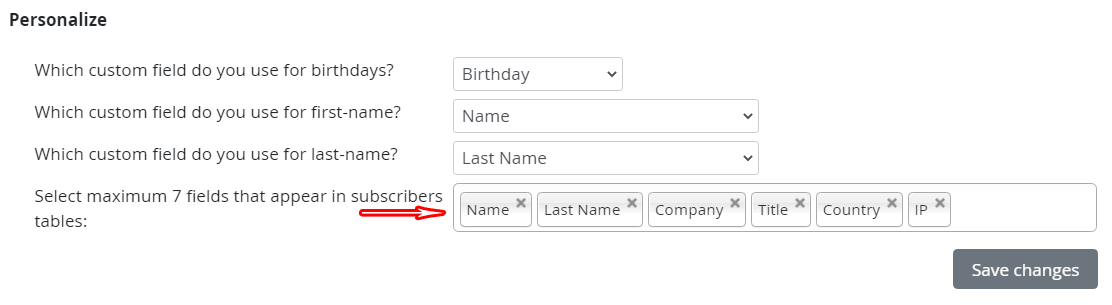
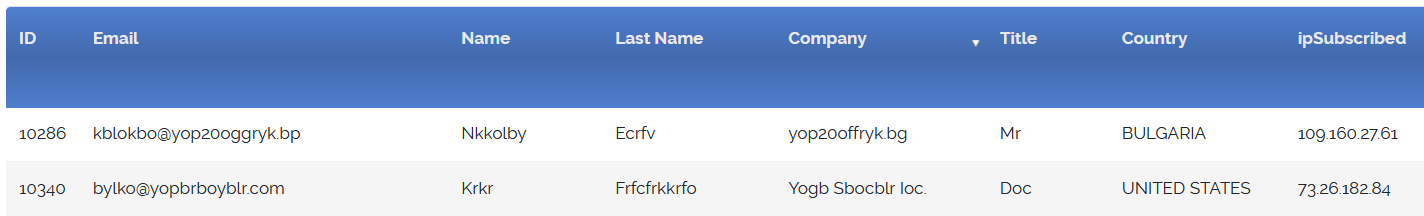
You can choose which columns to display in the subscriber reports where you set-up your custom subscriber fields.
The email is always included. Should you need to display more than 7 columns, contact us to show you how (it's an easy hack).
Summary report
To see your summary report go Menu > Reports > Summary report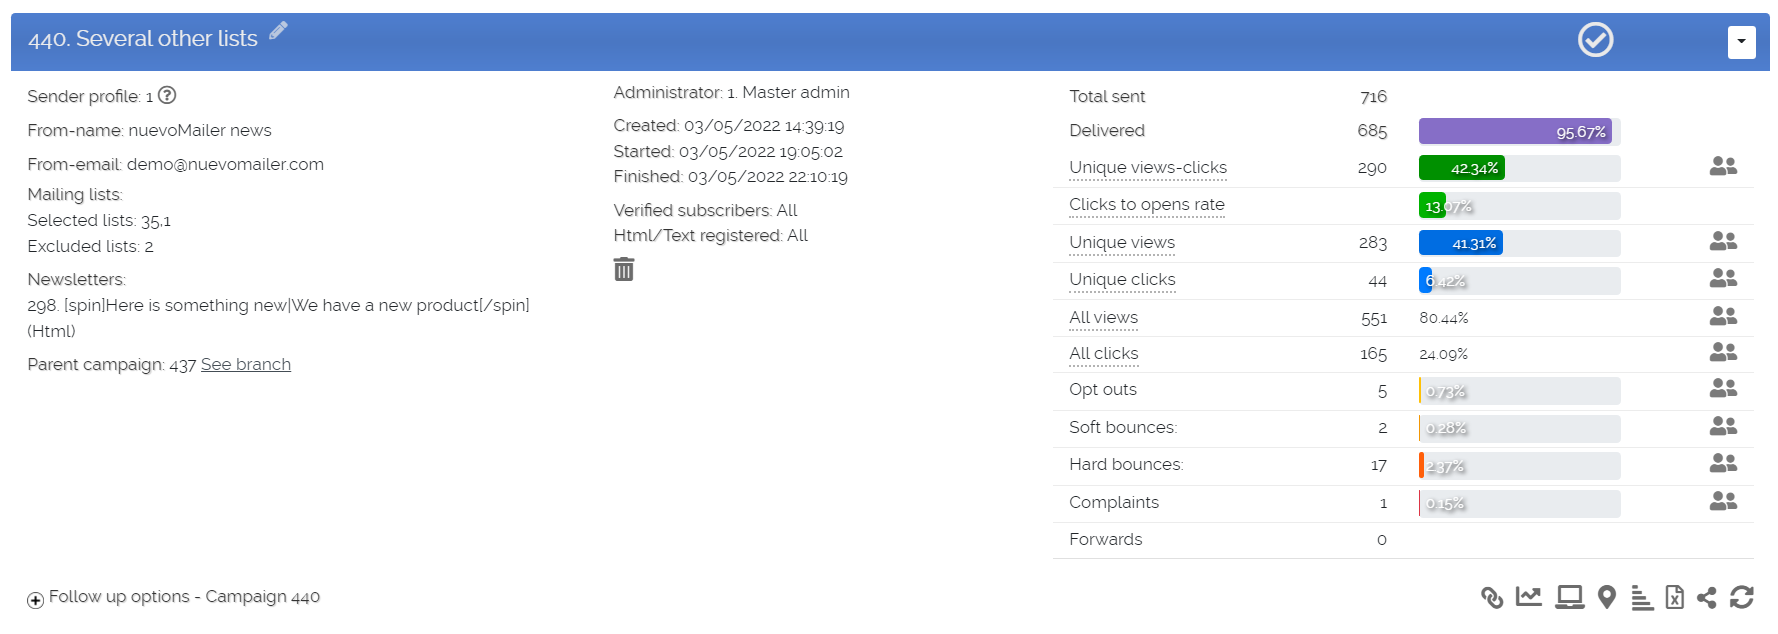
Clone campaign: create a new campaign with exactly the same characteristics.
Mouse over to see the Google analytics parameters you may have used in this campaign.
Click to add or edit your comments for this campaign.
Delete only the views statistics for this campaign.
See unique and total clicks for each link in the campaign.
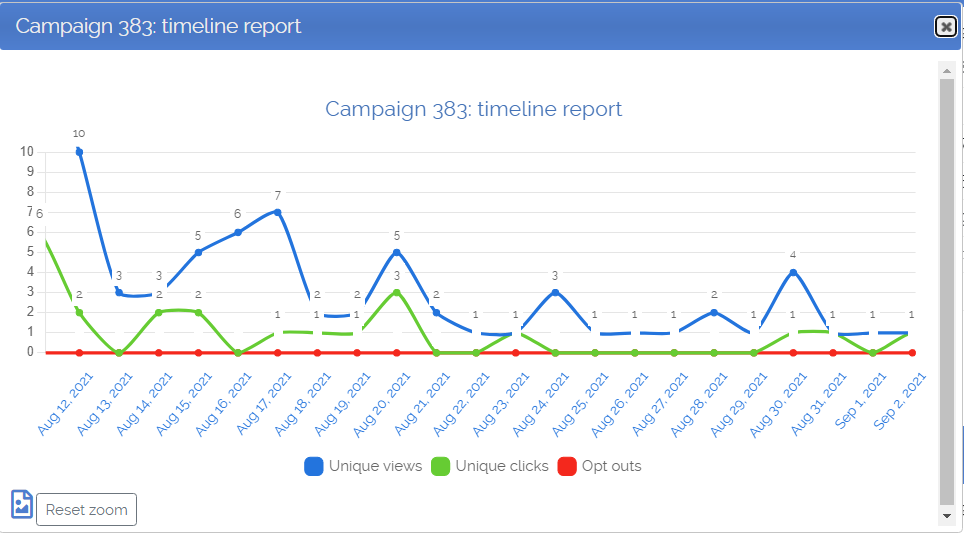
Campaign timeline report: see daily views, clicks and opt-outs.
Export to spreadsheet a complete report for this campaign.
Direct link for stats-only view. Right-click and copy this link.
By giving this link to other people they can see a complete campaign report without having to login to the administration panel.
Very handy when sending campaigns on behalf of your customers. Real example.
Reload the summary report.
Geolocation report.
Multiple views analysis report.
What do these metrics mean
Mouse over any metric and you will see a bubble with a detailed explanation: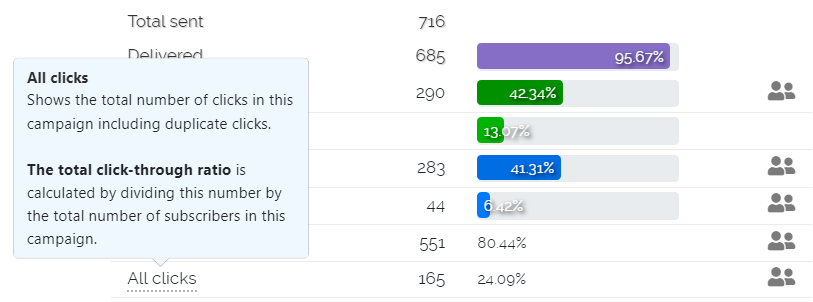
Mouse over any metric and you will see a bubble with a detailed explanation:
Unique vs Totals
- Unique views or clicks refer to subscribers.
- Total views or clicks refer to the campaign.
- Unique views or clicks refer to subscribers.
- Total views or clicks refer to the campaign.
Views are usually under-reported
A "newsletter view" can only be captured when the subscriber is online when opening the email and has explicitly allowed image downloading.
This means that your real views are somewhat higher than those captured and reported.
If the recipient has defined you as trusted or verified sender then image downloading is in most cases automatically enabled for your emails.
When the subscriber follows the link to read the newsletter in his browser then this view is always recorded.
Delivered: this is available for sending methods that report/send a delivery notification.
Hard & soft bounces are calculated based on Total sent.
Views and clicks are calculated based on Delivered or Net total (= total sent minus hard bounces).
Deleting statistics
Statistics are deleted when you delete them manually or when you delete the campaign.
Statistics stay in your database even if you delete a mailing list, a newsletter or a subscriber.
Statistics are deleted when you delete them manually or when you delete the campaign.
Statistics stay in your database even if you delete a mailing list, a newsletter or a subscriber.
Clicks report
Menu > Reports > Clicks reportThis report shows all hyperlinks that were clicked in all campaigns, starting from the most recent
one.
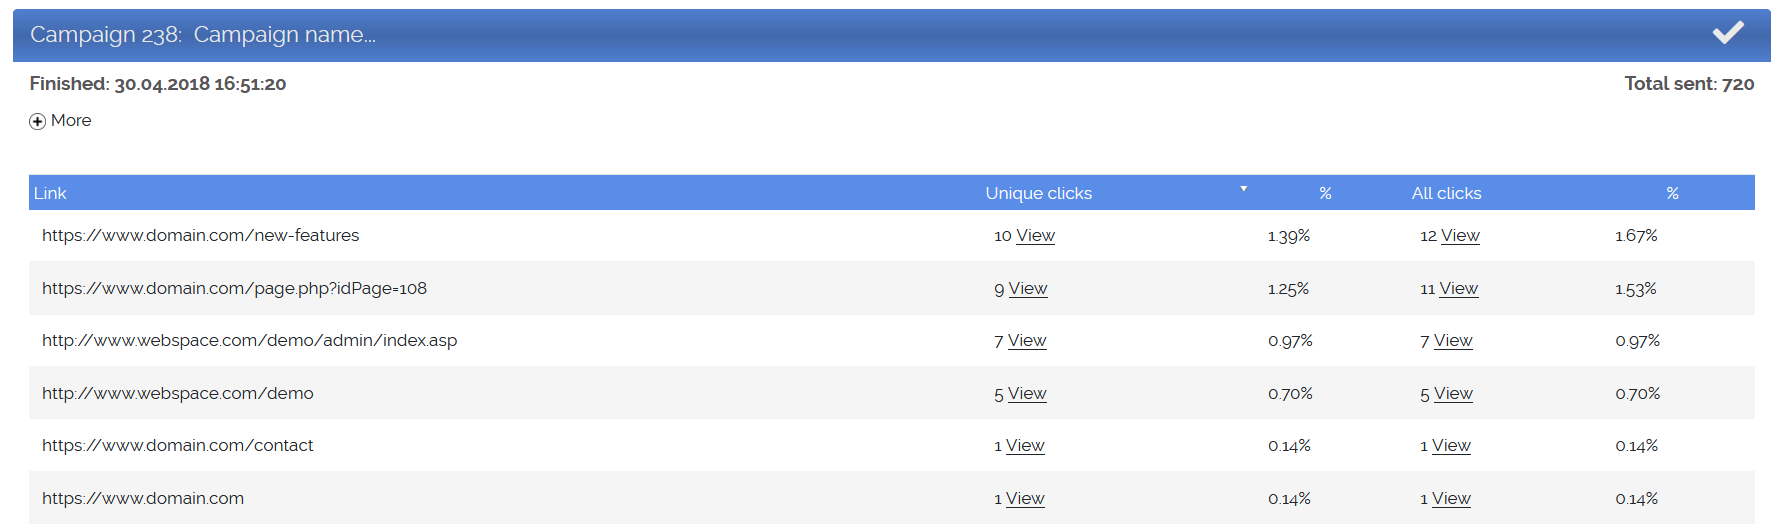
- Columns are sortable.
- Clicking on "View" will take you to the subscribers who clicked this link.
- This report is the same as the one you can open from your summary report when you click .
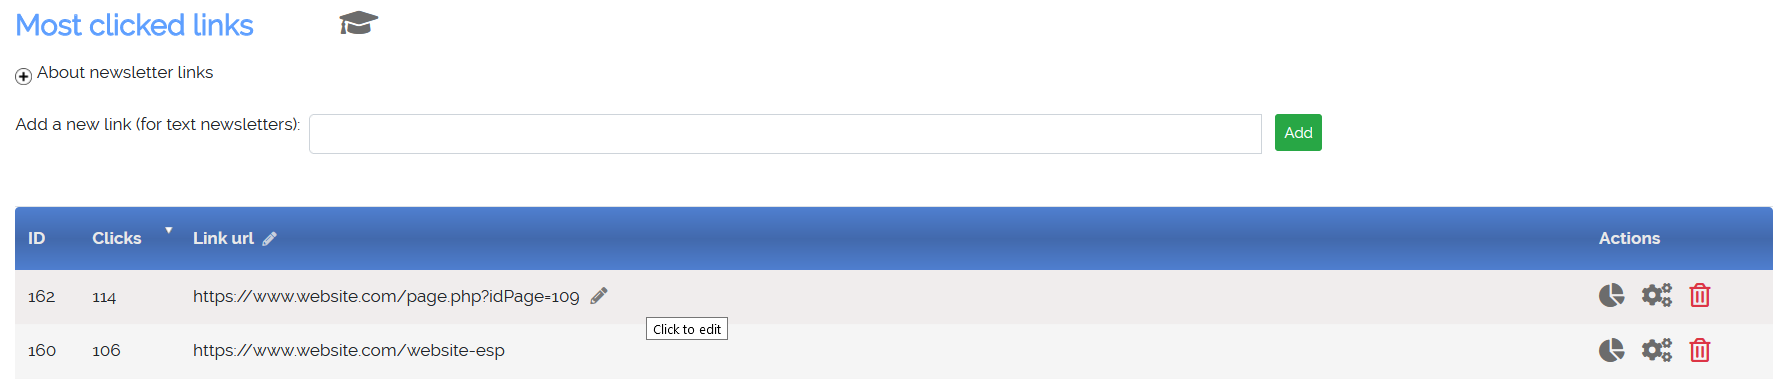
Most clicked links
Menu > Reports > Most clicked links
This report shows all hyperlinks from all newsletters (campaigns) and the clicks they received.
If you click the icon you will see the number of clicks this link received by campaign.
If you click the icon you will see the number of clicks this link received by campaign.
If you click this icon you can add a trigger for tis hyperlink.
The Link tracking mechanism replaces your newsletter links with shorter friendlier ones.
Every link is extracted, it gets an ID as you can see in the report below.
Every link is extracted, it gets an ID as you can see in the report below.
Link tracking & fixing broken links
Assume that you send your newsletter and then you discover that some links were broken.
Pause your campaign. Then open the newsletter and fix these links. This change will take effect with the next batch.
But you can also correct the links for the newsletters you already sent.
Simply go to your Most clicked links report, find the bad link click and edit it.
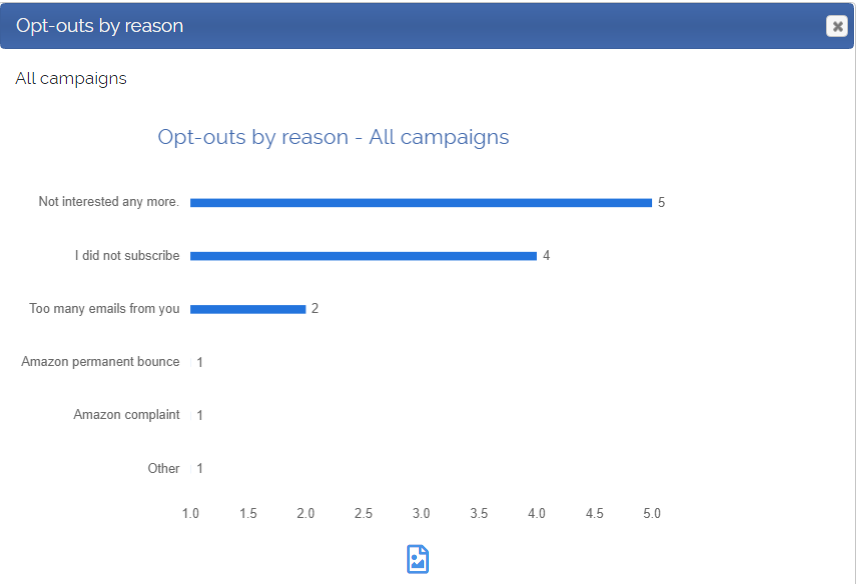
Opt-outs and reasons
Menu > Reports > View opt-outs and reasonsAll opt-outs are saved. You will see the subscriber's email, the type of opt-out, the time, the IP and optionally the reason (if you have enabled this option).
The data behind this report is important because it is used as an exclusion filter when importing subscribers. It prevents you from re-importing subscribers who have opted-out.
An entry in this report can be removed only in these 3 cases:
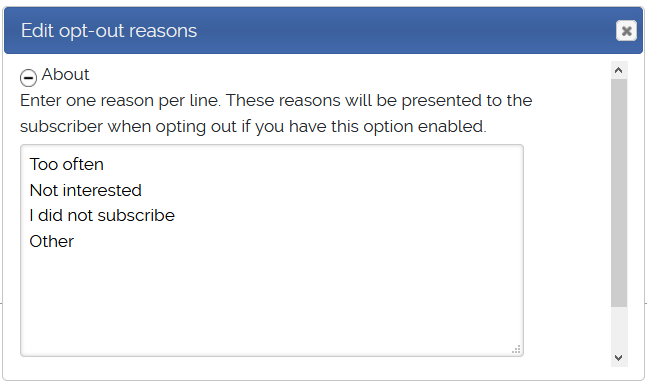
Predefined opt-out reasons
- The administrator manually empties the whole table or just one entry.
- When the subscriber subscribes again by himself, using a form.
- When the subscriber logs in and updates his account.
Since v.8.5 you can add a list of reasons for the subscriber to choose (one) when he opts out.
Since v.9.8 the opt-out reasons are defined separately for each Sender profile.
See also the Snooze option.
When you use the opt-out form (instead of the special opt-out links which is the recommended method), asking for an opt-out reason will fail.
If you enable this option the subscriber will see an drop-down menu and he is required to choose a reason in order to complete the opt-out. Furthermore you can see a very valuable report about why subscribers opt-out.
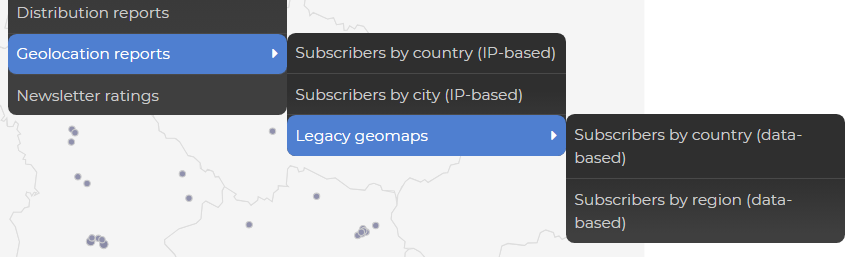
Geolocation reports and Geomaps
You have two ways to create Geolocation maps. Based on IP and based on subscriber demographic data that you collect.
IP-basedMenu > Reports > Geolocation reports > Subscribers by country (IP-based)
Menu > Reports > Geolocation reports > Subscribers by city (IP-based)
Data-based
Menu > Reports > Geolocation reports > Legacy geomaps > Subscribers by country (data-based)
Menu > Reports > Geolocation reports > Legacy geomaps > Subscribers by region (data-based)
IP-based geolocation reports were introduced in nuevoMailer v.7.5.
They use MaxMind free GeoLite2 or commercial database (recommended for greater accuracy).
Country and city names are derived from IPs and the maps are drawn using the Google visualization api.
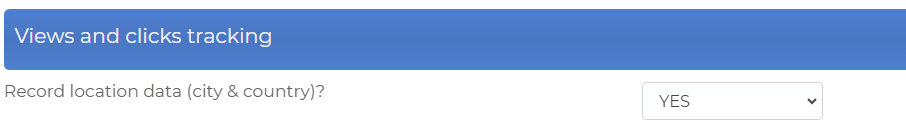
You can elect to record (or not) location data in Menu > Tools > Configuration & settings:
Legacy geomaps
Legacy geomaps are based on data collected from your subscribers such as Country, State or Region and you can visualize it using the Google visualization api.
Legacy geomaps are based on data collected from your subscribers such as Country, State or Region and you can visualize it using the Google visualization api.
- Set-up (for data-based legacy geomaps)
- In order to be consistent in the names you use you will find inside the folder install the file states_regions.txt where you can copy values for World countries, US States, Australian and Canadian provinces and Italian regions.
- You will use these values when setting your custom subscriber fields.
- In addition go to Menu > Tools > Configuration & settings, click Additional settings and scroll to this section: Google Api Reports (legacy). In older nuevoMailers version these custom fields were defined in /inc/settings.php.
Is your country covered by the Google visualization api?
In this case you can follow the above steps to activate and use the Geomaps.
In this case you can follow the above steps to activate and use the Geomaps.
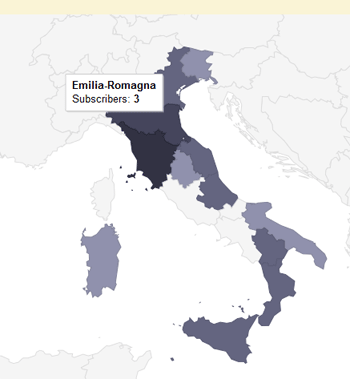
Example for Italy using regions (data-based legacy geomap)
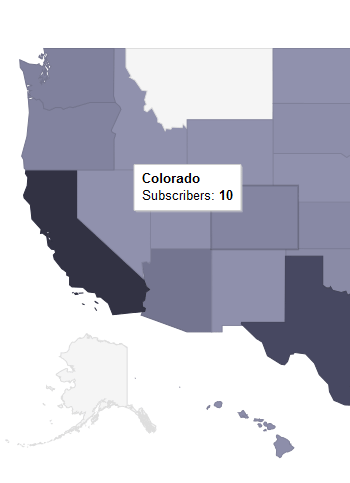
Example for USA using states (data-based legacy geomap)
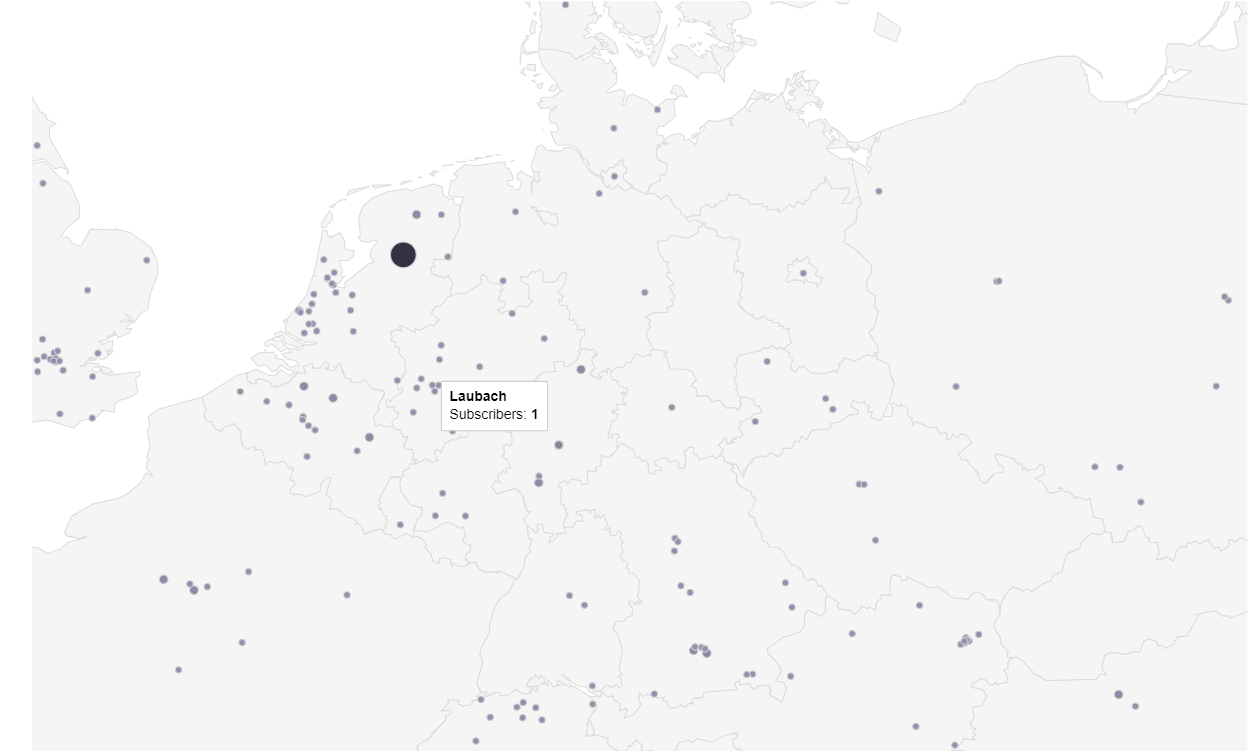
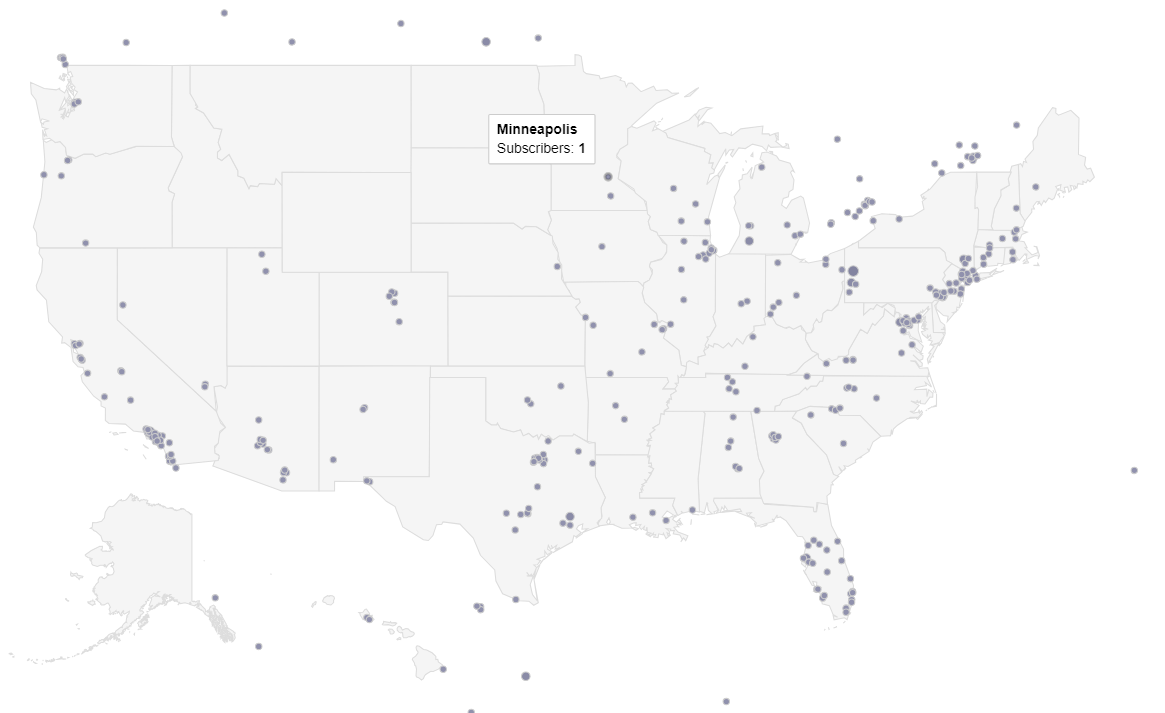
Some other examples: IP-based geolocation by city
Distribution reports
Menu > Reports > Custom reports > Distribution reportsDistribution reports are available for subscriber fields for which you define multiple options: Radio buttons, Drop-down menus and Check-boxes.
In these cases the subscriber can only choose from a set of predefined values (either one or more but always preset).
Therefore it is statistically feasible to group the subscribers according to their choices.
Examples include distribution by gender, region, country, state etc.
In these cases the subscriber can only choose from a set of predefined values (either one or more but always preset).
Therefore it is statistically feasible to group the subscribers according to their choices.
Examples include distribution by gender, region, country, state etc.

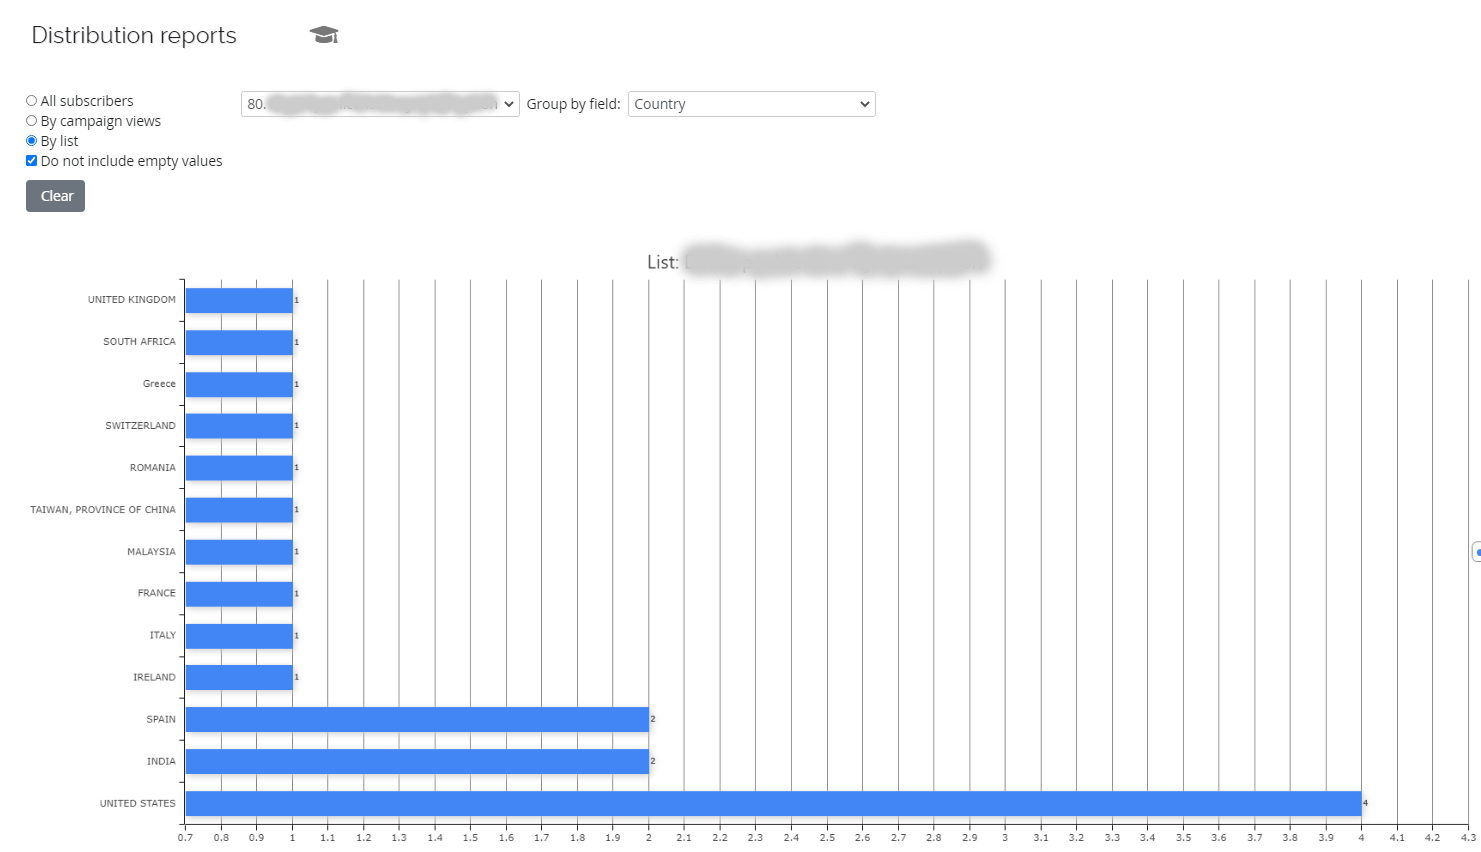
Distribution reports are available for the subscriber fields for which the Form input is set to Radio buttons, Drop-down menus or Check-boxes.
Here is an example using a country custom field and further segmenting by a specific list:
Timeline reports
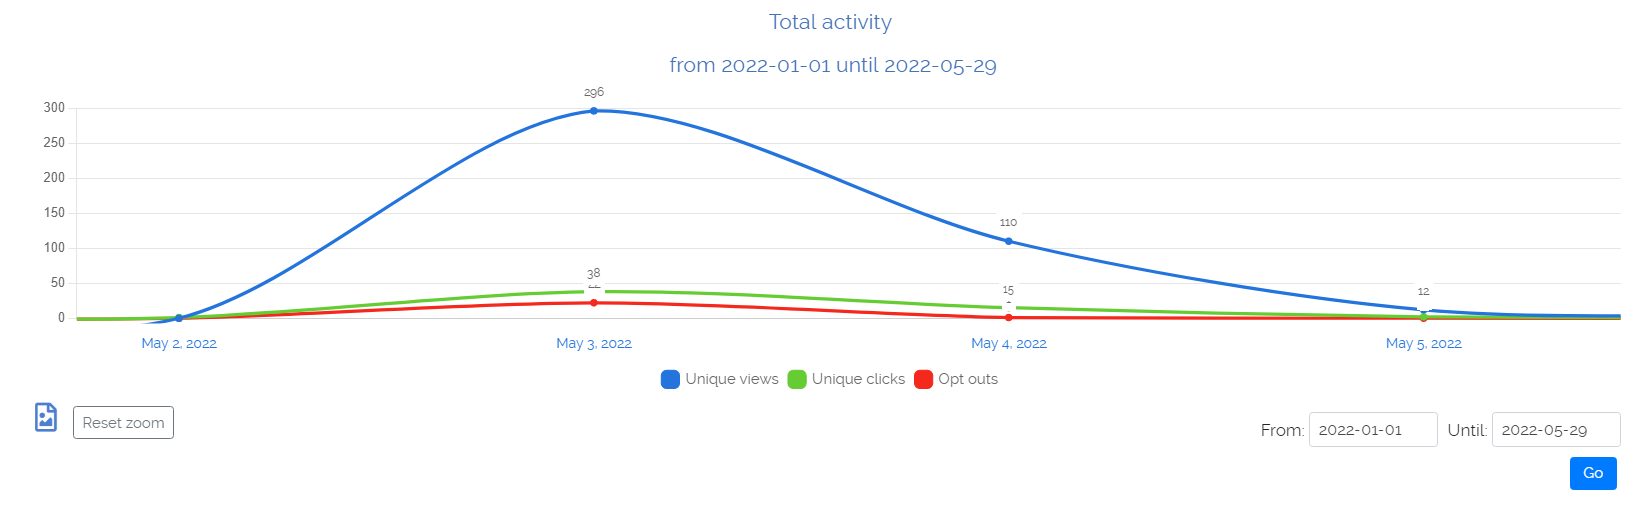
The timeline reports, also called trend reports, show unique views, clicks and opt-outs by day.
Note that unique in this context refers on a single day and not overall.
For example, if 90 subscribers open the newsletter at least once in a single day then unique views per day are 90.
If some or all of them open (or click) the newsletter the next or any other day they will still be included in that day's unique views/clicks.
The first timeline report is at the bottom of your welcome page.
It includes all campaigns and by default loads data for the last week.
From your summary report you can also see the timeline report for a campaign when you click this icon .
It includes all campaigns and by default loads data for the last week.
From your summary report you can also see the timeline report for a campaign when you click this icon .
Timeline reports are quite interesting because they show the subscriber interaction over time.
Of course one will notice that 70-90% of views or clicks happen the first 2-4 days after the campaign. But many will notice that subscribers keep looking at the newsletters (open or click) even weeks or months after the campaign was sent.
Of course one will notice that 70-90% of views or clicks happen the first 2-4 days after the campaign. But many will notice that subscribers keep looking at the newsletters (open or click) even weeks or months after the campaign was sent.